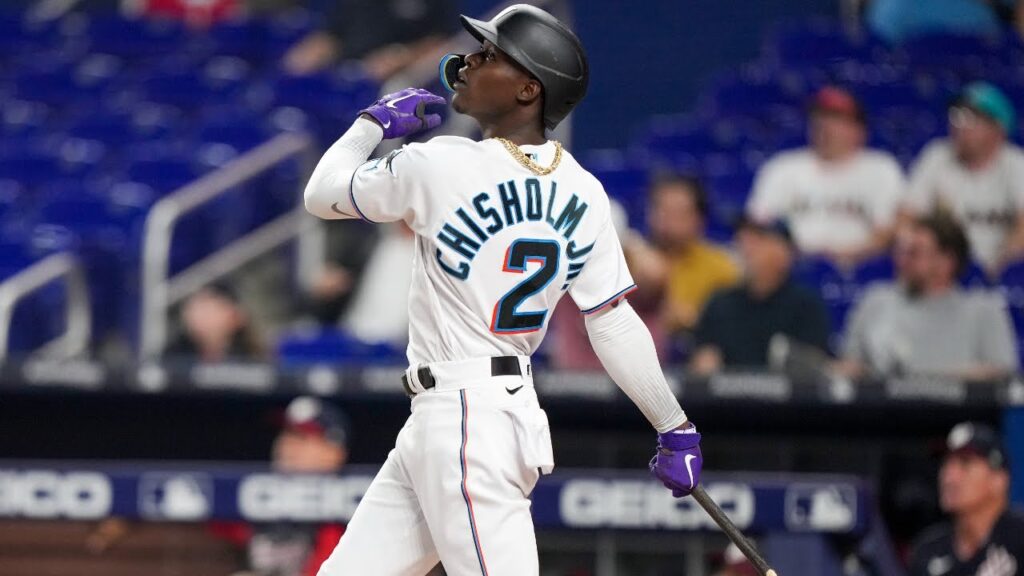
Mayhem should be the perfect adjective to describe what is about to transpire over the next seven weeks in the National League. There are four teams within three-and-a-half games of the top wild card spot, and four teams within five-and-a-half games within the No. 3 wild card. Feeling claustrophobic? It’s supposed to be that way. This is the time of the year that brings even a cool, calm and collected fan to their proverbial knees. Bring it.
Here is a rundown of teams currently in a National League wildcard spot, and teams within shouting distance.
(Standings, stats and odds are through August 15. Odds are attributed to Fangraphs)
| PLACE | TEAM | W | L | GB |
|---|---|---|---|---|
| 1 | Philadelphia Phillies | 65 | 55 | +2.5 |
| 2 | San Francisco Giants | 64 | 56 | +1.5 |
| 3 | Miami Marlins | 63 | 58 | - |
| 4 | Chicago Cubs | 61 | 58 | 1 |
| 5 | Cincinnati Reds | 62 | 59 | 1 |
| 6 | Arizona Diamondbacks | 60 | 60 | 2.5 |
| 7 | San Diego Padres | 57 | 63 | 5.5 |
Philadelphia Phillies
Runs per game: 4.59 (No. 14 in MLB)
Opponent runs per game: 3.92 (11)
Record since July 1: 22-17
Odds to make playoffs: 81.9%
Why they make the playoffs: Since August 1, the Phillies rank No. 9 in team offense by wRC+ (116). It’s a small sample, but a solid improvement for a team that for the overall season rank No. 17 with a 99 wRC+. With the pitching staff scuffling — we’ll get to that briefly, they are going to need the offense to perform. Bryce Harper is swinging the bat well since coming back from injury and Trea Turner seems to be getting back on track (.270/.323/.435 over his last 124 plate appearances) after a poor start to the 2023 season. That will need to continue for the Phillies to hold on to the No. 1 wildcard spot.
wRC+ takes the statistic Runs Created and adjusts that number to account for important external factors — like ballpark or era. It’s adjusted, so a wRC+ of 100 is league average and 150 would be 50 percent above league average. – MLB.com
Why they miss the playoffs: While the Phillies rank No. 1 in team pitching fWAR for 2023 (16.9), it hasn’t been as fruitful of late. The bullpen since July 20 has a total xFIP of 4.48 (No.22 in MLB) and the rotation while holding a solid ERA of 3.62 has an xFIP of 4.26 (No. 17 in MLB) in that same time frame. Aaron Nola in his last five starts holds a 4.91 ERA and has given up 5 home runs. The rotation lacks top end impact, Zach Wheeler has pitched well with a 3.63 ERA in 2023 with an fWAR of 4.50. However, the rest of the rotation combined (starters with over 30 IP) has been worth just 8 fWAR. Health could be an issue with Brandon Marsh, Jose Alvarado and Cristian Pache not returning until late August. Barring catastrophic injury, this team looks well set-up for a run at and into the postseason.
San Francisco Giants
Runs per game: 4.38 (18)
Opponent runs per game: 3.85 (8)
Record since July 1st: 18-20
Odds to make playoffs: 71.1%
Why they make the playoffs: Pitching. Since July 20, the Giants rank No. 1 in MLB in bullpen fWAR (2.0) and the rotation is No. 1 in xFIP (3.43) in the same time frame. Despite bottom rotation depth, Logan Webb and Alex Cobb at the top have pitched well to the tune of ranking No. 2 and No. 5 in xFIP (2.96, 3.44) in the National League among starters with over 50 innings pitched. The defense has been solid all year, holding an OAA of 14, good for No. 6 in MLB in that category.
Why they miss the playoffs: Offense. The runs per game (4.38) says they are a just-below-average offense for the year, but recently it has gotten much worse. In the month of July the Giants ranked dead last in the majors in team batting average (.209), slug (.343) and wRC+ (74). The Giants attempted to get some help at the plate at the deadline, adding AJ Pollock from Seattle and hoping to revive his season. However, he has just six plate appearances in the five games he has played in with the team and no hits, or walks. Lets pile on. Of their remaining games, the teams they face own a .521 winning percentage. That ranks No. 5 in the most difficult schedules of MLB teams going forward. If I am a Cubs, Reds or Diamondbacks fan, this is the team I will be watching very closely to see if they can hold on to their current spot in the standings.
Miami Marlins
Runs per game: 4.09 (26)
Opponent runs per game: 4.12 (15)
Record since July 1st: 15-23
Odds to make playoffs: 49.2%
Why they make the playoffs: Lets not sugarcoat it. This team is trending in the wrong direction recently. But lets get to that in a minute. Recently, they’ve limited strikeouts at the plate (team 20.7 K% since July 1) and hold a team .261 BA (also since July 1) which is good for No. 8 in MLB within the specified time. On the year, they rank No. 4 in team fWAR in the National League on the pitching side of things. Jazz Chisholm jr. is back from injury and holds a 108 wRC+ in the 58 games he has played in, and new deadline addition Jake Burger is slashing .306/.370/.449 since joining the team in 54 plate appearances.
Why they miss the playoffs: The Marlins started off 1-6 in August before bouncing back with a couple of wins against the Reds. From July 14-22 they lost eight straight games. This team can’t afford to drop games in bulk at this point of the season. Despite limiting opponent runs per game at an average rate for the year, the pitching staff ranks No. 23 in fWAR in August and are walking 3.53 batters per nine innings. While they’ve limited strikeouts for the year at the plate, the offense has a BB% of just 6.9 (3rd worst in MLB). With series against the Dodgers, Padres, Rays and Nationals to finish August and the Cubs suddenly red hot, the Marlins need to find the magic they had in June to keep their wildcard spot.
Chicago Cubs
Runs per game: 5.04 (5)
Opponent runs per game: 4.13 (16)
Record since July 1st: 23-16
Odds to make playoffs: 49.0%
Why they make the playoffs: The saying “it’s not who you play, it’s when you play them” encapsules how teams feel about playing against the 2023 Chicago Cubs. After starting the year 24-31, they’ve gone 37-27 since. They rank No. 10 in MLB in wRC+ since June 1 and the pitching staff has backed it up with an ERA of 4.24 (No.16 in MLB). That may seem pedestrian, but it is exactly what the doctor ordered. Good offense, average pitching and a path forward for the season. Oh, and Cody Bellinger is still mashing. Since July 15: .373/.418/.618 with a 178 wRC+ and seven home-runs.
Why they miss the playoffs: Since July 1 the Cubs’ pitching staff holds a 4.75 ERA (T-21st in MLB) with an fWAR worth 2.2 (No. 19 in MLB). The bullpen itself in that time is walking 4.02 batters per nine innings and sport a K-BB% of just 13.1 (19). For the Cubs to make the playoffs, the offense has to continue its scorching pace and hope the pitching staff can hold it together.
Cincinnati Reds
Runs per game: 4.80 (9)
Opponent runs per game: 4.74 (26)
Record since July 1st: 18-21
Odds to make playoffs: 22.4%
Why they make the playoffs: Before we get started here, I need to note… this team is extremely fun to watch. Speed, home-runs and young stars. Since the beginning of June they rank No. 5 in HR in the big leagues, No. 1 in stolen bases, and have young blossoming position players coming out of their ears. They have a top ten OBP for the year (.327, No. 8) in the majors and Matt McLain would be a National League rookie of the year leader if it weren’t for Corbin Carroll.
Why they miss the playoffs: Despite all the offense, power and fun. The pitching staff isn’t on the same page. Cincinnati is 3-10 in August and the bullpen so far this month sports a 5.94 ERA (ouch) and a 6.04 FIP (that hurts). Somehow, the rotation has been even worse. Putting together a 6.35 ERA and allowing 1.99 dingers per nine innings. Once a bright spot in the rotation, rookie Andrew Abbott in August in two starts has allowed 8 earned runs in 11.1 innings pitched. This all happening while Elly De La Cruz (90 wRC+ this month) has cooled off and is striking out in over 40% of his plate appearances certainly reduces all the fun. Look for this offense to attempt to carry the pitching staff into the postseason.
Arizona Diamondbacks
Runs per game: 4.68 (12)
Opponent runs per game: 4.58 (25)
Record since July 1st: 12-26
Odds to make playoffs: 23.7%
Why they make the playoffs: Good question. Kidding, that was only semi-serious. The Diamondbacks need to find whatever they had in April, May and June (48-33 in those months) and get it back, lock it away in a safe and hold on to it forever. The trade for Paul Sewald netted them a legitimate high leverage threat for the bullpen, but took away some offensive depth in Rojas and Canzone. While the offense is currently is struggling, the pitching staff has managed an xFIP of 3.52 in August, despite an ERA of 4.99, suggesting they’ve been a bit unlucky.
Why they miss the playoffs: The offensive fall off after June is almost unexplainable. In April-June, they were an above average offense as a whole (107 wRC+) and struck out just 20.0% of the time. All that has changed. Since then, they have managed just a 85 wRC+ and are striking out at a 21.4% clip. That doesn’t sound like too much of an increase in K% but for a team that doesn’t homer much, it matters. Corbin Carroll after his blistering start to the season is a big reason for the lack of offense. Since July 1, his slash line is just .220/.315/.386 with a 90 wRC+. This team will need Carroll and the offense to get back on track to stay in the hunt.
Can the Padres can claw themselves closer in the Wildcard race? We’ll check back here in a few weeks.
- PODCAST: The One Where Juan Soto is a Yankee, Shohei Ohtani has options and the market is on hold - December 7, 2023
- DOTS: Impact of Eduardo Rodriguez signing with Diamondbacks - December 7, 2023
- DOTS: Impact of Craig Kimbrel signing with Orioles - December 6, 2023


