“Who’d have thought the frisbee would have caught on?” — Karl Pilkington
Indeed, Karl. Indeed. The breaking ball has taken on many forms over 180 years of the baseball. Whether by way of Abner Doubleday or William Arthur “Candy” Cummings, spinning the baseball turned the sport on its head. Call it what you want. The “curve,” a “hook,” the “deuce,” a “bender,” a “snapper,” or “Uncle Charlie”, breaking balls have adopted many names and forms over the years.
And things have only gotten more extreme. Pitchers are throwing more breaking balls than they ever have. Slider usage jumped north of 22 percent in 2023, an all time high. The pitch has seen a usage jump in ten consecutive seasons going back to 2014. Cutters, one would argue an adaptation of the slider (though technically labeled in the fastball family) saw it’s highest usage ever last season as well, thrown 7.5 percent of the time. Curveball usage remained reasonably steady at 9 percent, though it has marginally tracked down for the last few seasons. For the second consecutive year, and the only two seasons in the history of the sport, fastballs were thrown less than 50 percent of the time. Add it all up and pitchers are looking to rip through some form of a breaking ball (if you include the cutter) close to 40 percent of the time.
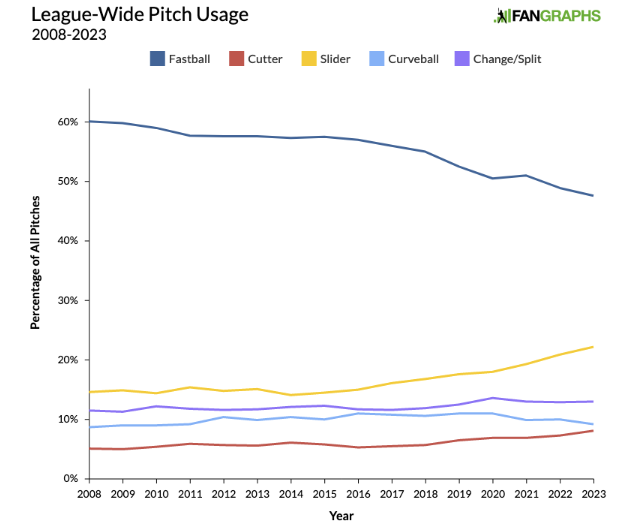
It’s not just usage either. Breaking ball velocity continues to steadily climb. Over the last three seasons, the average slider velocity sits at 84.5 mph, up from 83.3 mph a decade prior. Cutter velocity is up to 89.1 mph from 87.5 in the same period. Curveball velocity is up to 79.9 mph from 77.3 mph a decade prior. Pitches are getting firmer. And pitchers are still spinning the absolute hell out of the ball despite Major League Baseball’s “crackdown” on sticky stuff.
While the ability to hit velocity will always act as a gatekeeper for big league hitters, the impact bats in this league do damage against secondary weapons. That is more paramount than ever with usage rates spiking. Pitchers are consistently pitching backwards and using multiple planes at their disposal to play with a hitter’s eyes. Elevated fastballs and “turbo sinkers” are creating new pitch tunnels that were less understood, let alone utilized, in yesteryear. The short version? Hitters need to be ready for any pitch in any quadrant now more than ever.

While slider usage continues to climb, the league’s understanding of how a pitcher is looking to disarm bats has trended up. Slider whiff percentages have actually tracked downward the last five seasons. Even still, it continues to be the most effective pitch in the sport for getting swing-and-miss. The game rewards strikeouts these days and pitchers are chasing paychecks as well as the approval from front offices and their analysts. Curveballs continue to represent one of the more effective pitches in the sport as well. They draw the third-highest amount of whiffs in the league.
At first, the plan was to take a look and see how college hitters performed against any and all breaking balls north of 80 mph. That plan was quickly scrapped after recognizing very few in college baseball throw an 80 mph slider, let alone 80 mph curveballs. There were a number of ways to dilute the sample into more finite results, but in the end it was decided to lump all breaking balls into one entire bucket. The hope is to get a feel for which hitters see spin out of the hand and have the barrel awareness to do damage with the breaking balls they offer at.
The sample collected here represents the “Top 200” college hitters currently on the FSS 2024 Draft Board. Dissecting who can hit a good breaking ball and create impact on those swings was the goal. The variables for this chart include a hitter’s chase rate on breaking balls outside of the strike zone, their contact rate on breaking balls swung at, as well as their 90th percentile exit velocity as a means to show slugging and raw power upside.
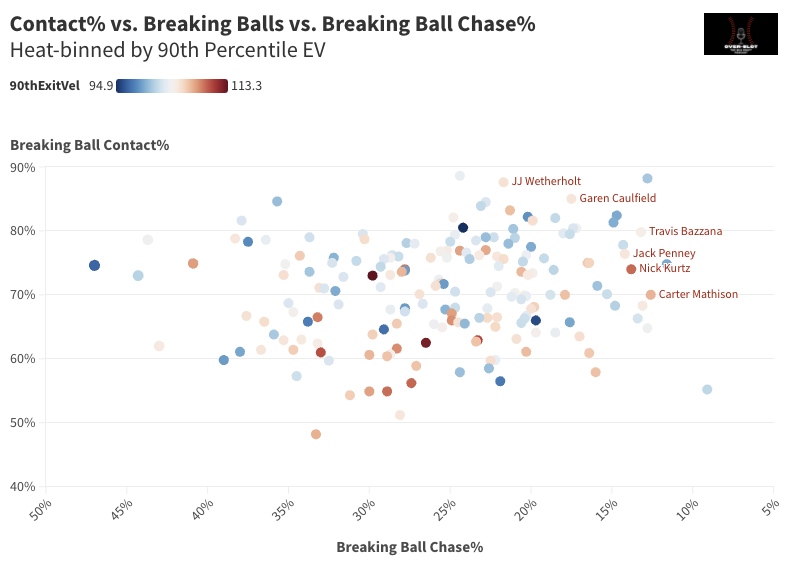
When reviewing who stands out with these parameters, immediately you find a correlation between the “top” guys in the draft class and their ability to handle breaking balls; or at least spit on spin outside of the strike zone. Oregon State 2B Travis Bazzana and Wake Forest 1B Nick Kurtz each currently rank inside the Top 3 overall prospects for the 2024 Draft. Both posted borderline elite chase rates on breaking balls in 2023. On the other side of the spectrum, West Virginia shortstop JJ Wetherholt didn’t post a terribly impressive chase rate on breaking balls, but he did post a truly elite contact rate against those pitches. All three players posted healthy exit velocity figures against spin as well.
If you read the Fastball Murderers piece from last week you may remember the name Garen Caulfield, infielder from the University of Arizona. He appears once again on this chart as a guy who made a ton of contact against spin, and posted impressive chase rates against the pitch as well. He’s a metric darling who is draft-eligible for the third time in 2024 and could be in store for a breakout campaign provided he holds down the full-time role at second base. He was the victim of a lot of bad batted-ball luck in 2023. He can spray ringing liners into the opposite field gap as well as anyone in the Pac-12 conference.
OF Carter Mathison (@IndianaBase) is a name to follow closely this spring. Burst onto the scene as a true Freshman in 2022 after hitting .273/.393/.608 with 11 doubles and Indiana Freshman record 19 HR. Had another productive season in ’23 to the tune of a .311/.426/.538 slash… pic.twitter.com/uPTz2v5p2A
— Peter Flaherty III (@PeterGFlaherty) January 26, 2024
Outfielder Carter Mathison is well-represented on this chart as a guy with a sound approach against spin and impressive peak batted-ball events. While he hardly ever expands the strike zone, there is a hole in his swing when trying to make contact on pitches outside of the zone. If he shores that up and battles into deeper counts, he could find himself a Top 100 pick in July.
Notre Dame third baseman Jack Penney is also kindly represented as a guy who does it all in an above average manner. There’s polish, some bat-to-ball skill, as well as strong peak exit velocities.
A few guys who stand out on this chart but are not labeled included Kansas State second baseman Brady Day, Virginia Tech infielder Eddie Micheletti Jr., and Arkansas infielder Jared Sprague-Lott. Day is the blue dot in the upper-right corner of the chart. He is draft-eligible for the second time and was the Atlanta Braves 12th round selection in the 2023 Draft. He’s one of the premier contact, slap hitters in college baseball. He lacks top-end ceiling without much power to speak of, but he does put the game in motion and plays a reliable second base. Micheletti Jr’s dot sits just to the left of Wetherholt’s on the chart. He was also featured in the Fastball Murderers piece. He’s transferring to Virginia Tech from George Washington and should put up tremendous offensive numbers as a versatile guy who is draft-eligible for the second time. He has day two upside. Sprague-Lott’s dot is sandwiched between Caulfield and Bazzana on the chart. He doesn’t have much raw power to speak of but he posted gaudy chase and contact rates in 2023 and should be a fantastic addition to the Hogs lineup having transferred in from Richmond.
We’re going to countdown the Top 10 moments from the 2023 CCBL season!
Starting at #10, Jack Penney’s (@NDBaseball) walk-off single to begin the CCBL playoffs.
The @FirebirdsCCBL would go on to reach the CCBL Championship for the first time since 2013! #CCBLTop10 pic.twitter.com/VL8WLxSPw8
— Cape League (@OfficialCCBL) September 11, 2023
In some ways it appears there’s a correlation between one’s ability to lay off breaking balls outside of the strike zone and one’s overall draft profile. Or in Wetherholt’s case, one’s ability to hit absolutely everything. Watching how a player identifies and reacts to spin is a good barometer on how much success they’ll have at higher levels. This chart proves as much.
- The Diamondbacks return for Josh Naylor… - July 25, 2025
- Five 2025 draft picks that could win Rookie of the Year in 2026 - July 21, 2025
- 2025 MLB Draft: The predictions you didn’t know you needed - July 16, 2025